

Next: 5. Conclusions/References
Up: 4. DWE Instrumentation: Ultrastable
Previous: 4.3 USO frequency characteristics
At this writing, only results from the EM test program
are available.
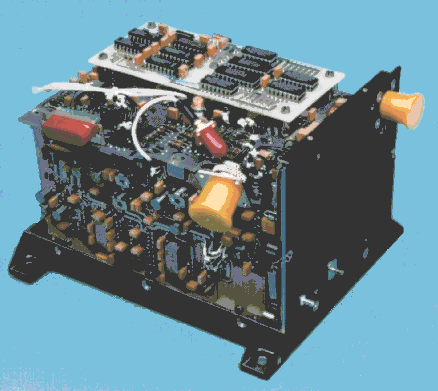
The DWE USO Electrical Model is shown in Fig. 9,
prior to integration with the aluminum housing removed.

Figure 9: The DWE-TUSO engineering model.
The input power connector and grounding studs are on the right side.
The remaining ports facing the viewer are (from left)
test connector (red, elongated), the 10 MHz RF output (red, round),
and the telemetry output connector (yellow).
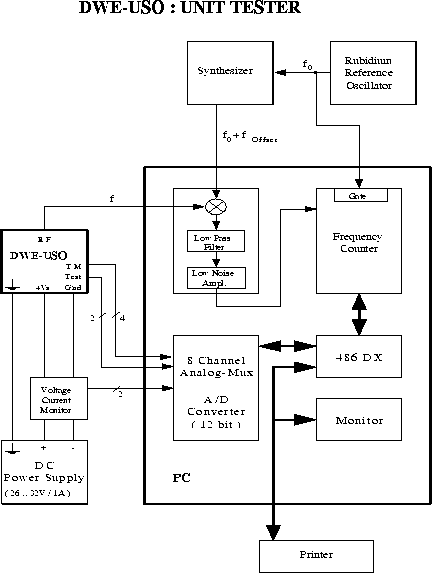
A USO test assembly (block diagram: Fig. 10),
developed at the University of Bochum,
is used at unit level to
determine USO frequency characteristics.
Of particular interest is the frequency stability
of the USO on all time scales.
It is also necessary to characterize the repeatability of the
long-term drift of the USO in order to correct for this effect
under the conditions of the Huygens descent.

Figure 10: Block diagram of the test assembly.
The frequency measurement procedure is based on a
comparison of the test frequency f (DWE-USO) with a reference
signal  (rubidium reference oscillator) whose frequency
stability is better than or equal to that of the test signal.
Using a synthesizer, the reference frequency is offset from the
nominal frequency of the test object
  by a known
amount
  .
The difference frequency of the two signals is generated with the help
of a mixer and then measured by a frequency counter.
Following a fully automated procedure, both the long-term and
short-term stabilities of the test
object are determined by recording the difference frequency
for an appropriately long interval (nominal test run: 3 hours).
The reference and offset frequencies, as well as the integration
and sample times can be adjusted as necessary with respect to their
default values for each individual run.
The number of single measurements is defined by the ratio of the
adjusted total measurement time to the mean duration of the
single measurement cycle.
A single measurement cycle consists of the adjusted fixed integration
time and the counter register read-out time.
The read-out phase requires about 20 ms.
The mean duration of one measurement cycle is thus about 1.02 sec
for an integration time of  = 1s, and 10.02s for
  = 10s,
respectively.
The absolute frequency  and the Allan variance
  are then derived as follows:


where  =
=  /
/ ,
,  =
=
 /
/ , and
, and  is the k
 cycle count over
the integration time
  .
.
Examples of short-term stability results from a typical
test run during the unit level TUSO-EM program are displayed in
Fig. 11.
Running measurements of  , defined by (26)
are made for integration times
  = 1 s and 10 s.
Each point in Fig. 11 represents
100 such measurements.
The mean values of the Allan deviation in this case were
 = 1.8·10E-11 and
 = 5.5·10E-12, respectively.

Figure 11: Short-term frequency stability
 of the DWE-TUSO Electrical Model.
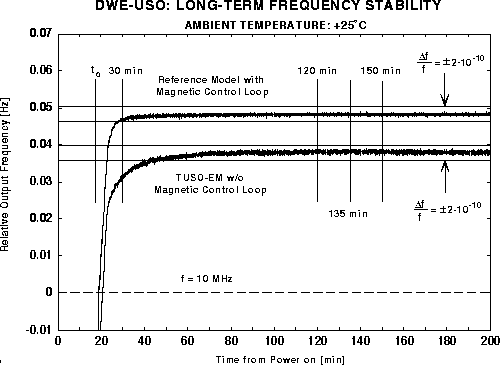
The behavior of the USO output frequency as a function of time from
switch-on is shown in Fig. 12 for two test models, one
with and one without a temperature-compensating magnetic control loop.
These tests were performed at an ambient temperature of
+ 25°C.
After reaching its asymptotic value, the output frequency of
both models stays within a band  <
<  2·10E-10.
The model without magnetic compensation was found to require too
much time to warm up and also exhibited undesireable variations in
asymptotic output frequency with temperature.
Significant improvement was achieved by implementation of a
magnetic control loop, which exploits the sensitivity of the rubidium
hyperfine transition to the strength of the magnetic field in the
rubidium cell.
The strength of the magnetic field applied to compensate the thermal
drift is determined via a feedback loop using the thermal sensor
in the crystal oscillator.
Preliminary results from recent thermal vacuum tests (FM Test Program)
over an ambient temperature range from - 30°C to
+ 60°C indicate that:
(a) the USO warm-up time is always less than 30 minutes, and
(b) the variation in mean asymptotic frequency is less than
2·10E-10.
2·10E-10.
The model without magnetic compensation was found to require too
much time to warm up and also exhibited undesireable variations in
asymptotic output frequency with temperature.
Significant improvement was achieved by implementation of a
magnetic control loop, which exploits the sensitivity of the rubidium
hyperfine transition to the strength of the magnetic field in the
rubidium cell.
The strength of the magnetic field applied to compensate the thermal
drift is determined via a feedback loop using the thermal sensor
in the crystal oscillator.
Preliminary results from recent thermal vacuum tests (FM Test Program)
over an ambient temperature range from - 30°C to
+ 60°C indicate that:
(a) the USO warm-up time is always less than 30 minutes, and
(b) the variation in mean asymptotic frequency is less than
2·10E-10.

Figure 12: USO output frequency as a function of
time from switch-on.


Next: 5. Conclusions/References
Up: 4. DWE Instrumentation: Ultrastable
Previous: 4.3 USO frequency characteristics
DWE Homepage - For further information contact r.dutta-roy@freenet.de


 (rubidium reference oscillator) whose frequency
stability is better than or equal to that of the test signal.
Using a synthesizer, the reference frequency is offset from the
nominal frequency of the test object
  by a known
amount
  .
The difference frequency of the two signals is generated with the help
of a mixer and then measured by a frequency counter.
Following a fully automated procedure, both the long-term and
short-term stabilities of the test
object are determined by recording the difference frequency
for an appropriately long interval (nominal test run: 3 hours).
The reference and offset frequencies, as well as the integration
and sample times can be adjusted as necessary with respect to their
default values for each individual run.
 = 1s, and 10.02s for
  = 10s,
respectively.
 and the Allan variance
  are then derived as follows:


 =
=  /
/ ,
,  =
=
 /
/ , and
, and  is the k
 cycle count over
the integration time
  .
.
 , defined by
  = 1 s and 10 s.
Each point in
  = 1.8·10E-11 and
 = 5.5·10E-12, respectively.

 of the DWE-TUSO Electrical Model.
 <
<  2·10E-10.
The model without magnetic compensation was found to require too
much time to warm up and also exhibited undesireable variations in
asymptotic output frequency with temperature.
Significant improvement was achieved by implementation of a
magnetic control loop, which exploits the sensitivity of the rubidium
hyperfine transition to the strength of the magnetic field in the
rubidium cell.
The strength of the magnetic field applied to compensate the thermal
drift is determined via a feedback loop using the thermal sensor
in the crystal oscillator.
Preliminary results from recent thermal vacuum tests (FM Test Program)
over an ambient temperature range from - 30°C to
+ 60°C indicate that:
(a) the USO warm-up time is always less than 30 minutes, and
(b) the variation in mean asymptotic frequency is less than
2·10E-10.
2·10E-10.
The model without magnetic compensation was found to require too
much time to warm up and also exhibited undesireable variations in
asymptotic output frequency with temperature.
Significant improvement was achieved by implementation of a
magnetic control loop, which exploits the sensitivity of the rubidium
hyperfine transition to the strength of the magnetic field in the
rubidium cell.
The strength of the magnetic field applied to compensate the thermal
drift is determined via a feedback loop using the thermal sensor
in the crystal oscillator.
Preliminary results from recent thermal vacuum tests (FM Test Program)
over an ambient temperature range from - 30°C to
+ 60°C indicate that:
(a) the USO warm-up time is always less than 30 minutes, and
(b) the variation in mean asymptotic frequency is less than
2·10E-10.
